
The Fleet TCO Model for Snow Plow Blades: A Framework for Smarter Buying
The purchase price of a snow plow blade is the smallest part of what the blade costs. A fleet that buys the cheapest edge can spend more on changeout labor, vehicle downtime, emergency inventory,…
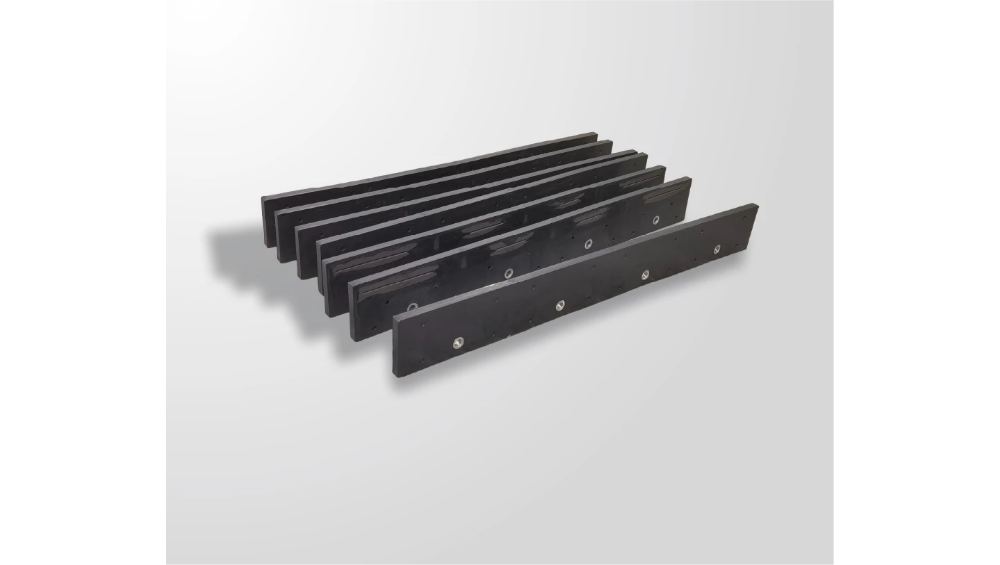
The purchase price of a snow plow blade is the smallest part of what the blade costs. A fleet that buys the cheapest edge can spend more on changeout labor, vehicle downtime, emergency inventory, and missed service in a single season than it saved on the purchase. Total cost of ownership, or TCO, is the framework that makes that visible, and it is the number a fleet should use before the next blade order.
This article defines the TCO model for snow plow blades, explains the five cost buckets that make it up, shows how to build a simple spreadsheet from data the fleet already has, and describes the places where fleets systematically undercount.
Purchase price is the smallest part of blade cost
TCO exists because blade decisions are made once a year but paid for all season. The blade price is a single line item on one invoice; the labor, downtime, and inventory that the blade choice drives are spread across every storm. A fleet that compares only prices is comparing invoices, not costs.
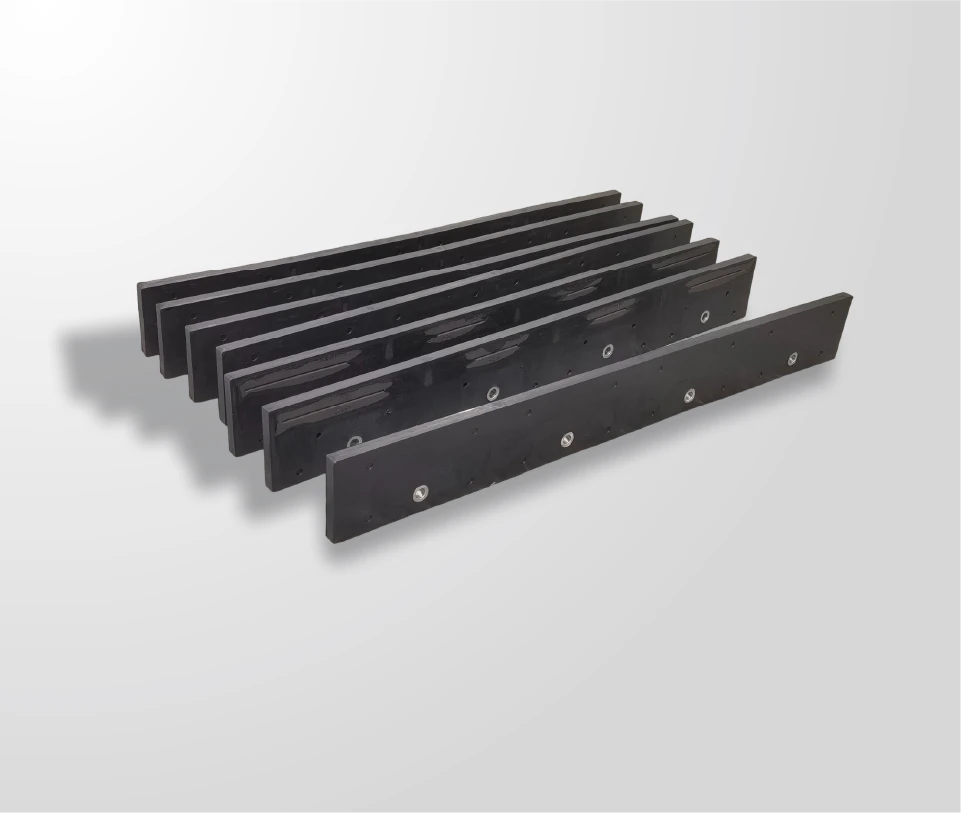
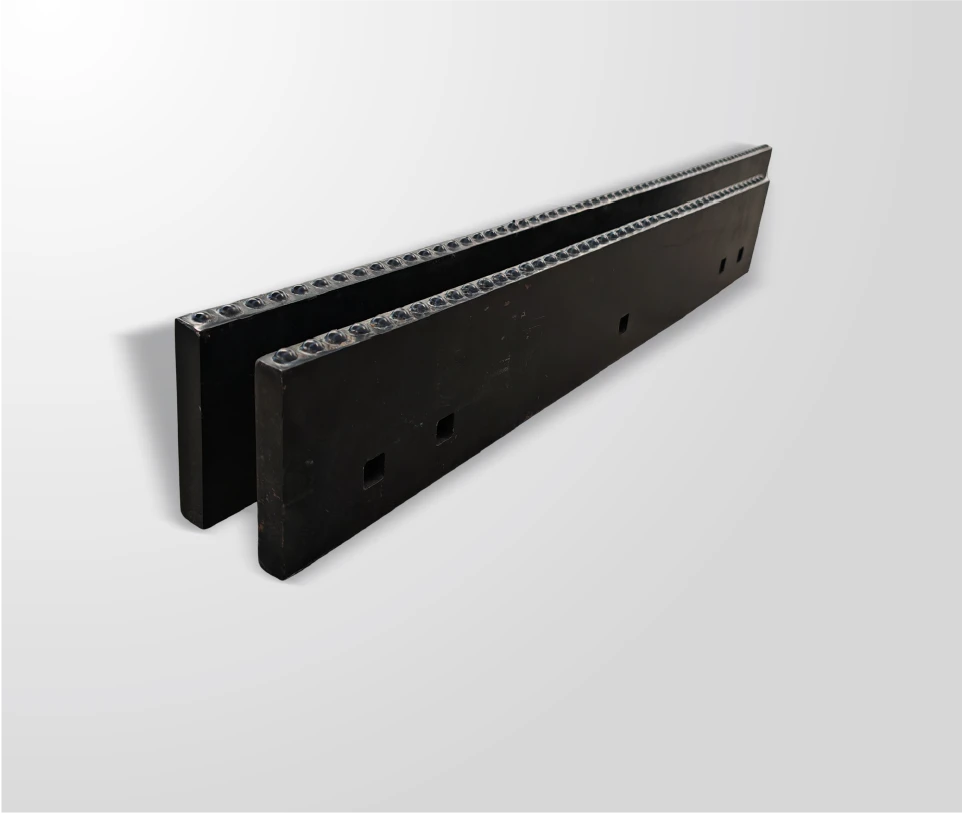
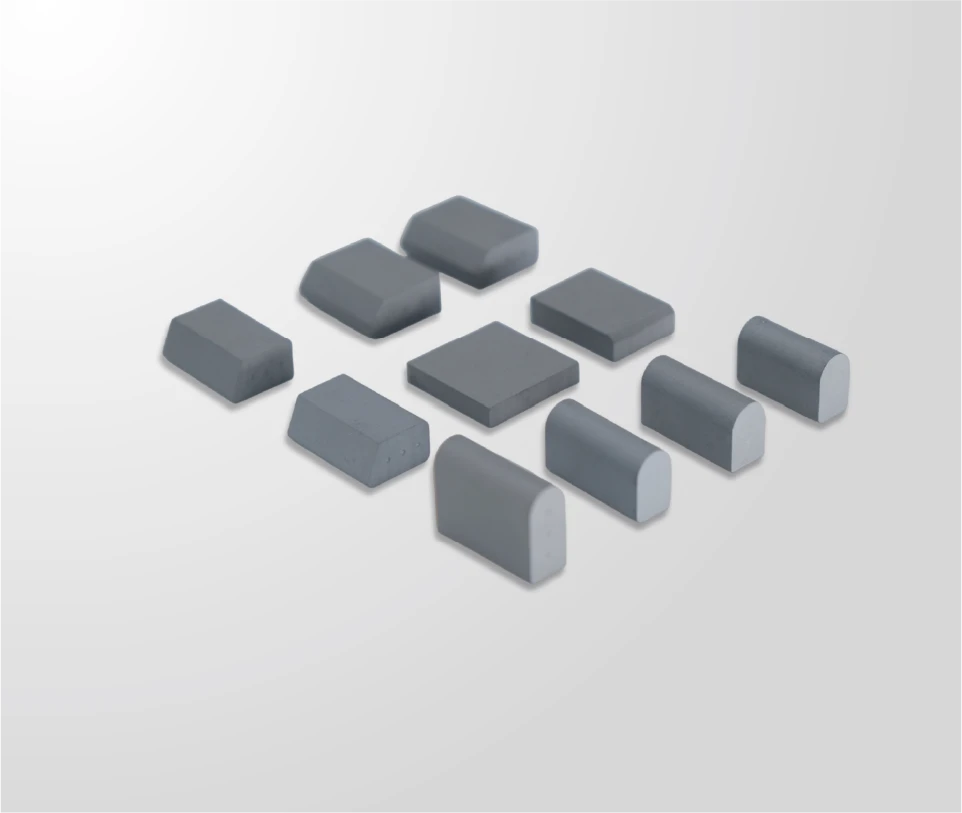
The counter-intuitive part is that a more expensive blade can have a lower TCO. If a carbide edge changes fewer times per season, the savings in labor and downtime can exceed the price difference. SENTHAI argues exactly this for its carbide snow plow blades: higher initial cost, lower overall cost, because fewer changeouts mean less labor and less downtime. The claim is directionally useful, and the TCO model is how a fleet tests it with its own numbers.
What are the five cost buckets in blade TCO?
The model organizes blade cost into five buckets:
1. Blade purchase cost. The invoice price of the edges consumed in a season, including freight.
2. Changeout labor. The shop hours spent removing old blades and installing new ones, at the fleet’s loaded labor rate.
3. Downtime cost. The value of the vehicle and crew out of service during each changeout, which for a contractor is billable time and for a municipality is route capacity.
4. Emergency inventory cost. The capital tied up in spare blades and the cost of expedited orders when stock runs short mid-season.
5. Risk and service cost. The cost of a blade failing at the wrong moment: missed service standards, extra chemical use, and the operational consequences of running a degraded edge.
Some fleets add fuel and moldboard wear, which are real but harder to isolate. The five buckets above are the core; adding more should be justified by data, not habit.
Building a simple fleet TCO spreadsheet
A TCO spreadsheet does not need special software. Use four columns per blade option: quantity, unit price, changeouts per season, and labor plus downtime per changeout. Then apply the calculation:
Seasonal TCO per truck = (Blade price × blades per season) + (Changeouts × labor and downtime per changeout) + (allocated inventory and risk cost)
The inventory and risk buckets can be allocated as a fixed allowance per truck until better data exists. The point is to include them, even roughly, because excluding them is what hides the real cost.
The illustration below uses assumed numbers and is meant to show the shape of the calculation, not a fleet result:
| Item per truck | Steel edge | Carbide edge |
|---|---|---|
| Blade cost per season | $600 | $2,400 |
| Changeouts per season | 6 | 1 |
| Labor and downtime per changeout | $450 | $450 |
| Subtotal | $3,300 | $2,850 |
| Inventory and risk allowance | $200 | $150 |
| Seasonal TCO | $3,500 | $3,000 |
The carbide option costs more per blade and still shows a lower seasonal TCO in this illustration, because the changeout savings exceed the price difference. Your fleet’s numbers will differ; the structure is what transfers.
Expert view — SENTHAI engineering team: “A TCO spreadsheet is a conversation starter, not a verdict. Fill it with the fleet’s own changeout log and labor rate, run it for one season, and the model becomes a management tool instead of a theory.”
Where do fleets systematically undercount?
The most common errors in TCO are the ones that favor the cheap blade:
- Counting the blade price twice and the labor once. Every changeout has labor, and the labor repeats as often as the blade changes.
- Ignoring downtime. A changeout during a storm window costs more than the same changeout in the shop on a Tuesday.
- Forgetting expedited freight. Mid-season emergency orders carry premium freight, and the premium is caused by the stock plan, not by the market.
- Using one average for all routes. A blade that lasts a season on one route and a month on another produces a misleading single number.
- Leaving out the cost of running worn. The extra passes and chemical use of a worn edge are real costs that never appear on an invoice.
The fix is not more software; it is recording changeouts by truck and route. One season of honest records turns TCO from an estimate into a measurement.
The route-level point deserves emphasis because it is where most fleets lose the most money. A fleet that averages changeout data across all trucks hides the ten trucks on abrasive corridors that burn edges at three times the fleet average. Those trucks are exactly where a more durable edge pays back fastest, and the average hides them. Running TCO per route group, even a simple high-wear versus normal split, surfaces the trucks that justify the investment.
Interpreting TCO for buying decisions
TCO answers two questions: which option costs less over the season, and how sensitive the answer is to the assumptions. Run the same spreadsheet with a conservative case, where the carbide edge changes more often than claimed, and an expected case, where it matches fleet history. If the conclusion holds in the conservative case, the decision is defensible; if it flips, the fleet should pilot before committing.
The model also guides where to act. If labor dominates the steel case, the fix is fewer changeouts. If inventory dominates, the fix is a better stock plan. TCO does not just pick a winner; it shows which cost to attack.
When the model points to a pilot, the pilot should measure the same buckets the spreadsheet uses: changeouts, labor hours, downtime events, and inventory draws on the pilot trucks, compared with a control group on the same routes. The spreadsheet predicts; the pilot verifies. If the pilot data confirms the conservative case, the fleet-wide decision has both a model and a field result, which is the combination budget committees accept.
Get route-specific data for a better estimate
The quality of the model is the quality of the input data. Before the next order, start recording changeouts by truck and route, labor hours per changeout, and any expedited orders. Even a partial season of data improves the estimate more than a full season of assumptions.
To build the calculation for your fleet, start with the carbide blade page for the product side and send your route and changeout data through the contact page for the specification confirmation. The spreadsheet belongs to the fleet; the model makes it usable.
Start the data collection now, even if the purchase decision is months away, because the first season of records is the one that makes every later estimate defensible.
Frequently Asked Questions
What is TCO for snow plow blades? Total cost of ownership is the full seasonal cost of a blade, including purchase price, changeout labor, downtime, emergency inventory, and risk and service costs, not just the invoice price.
How do I calculate blade TCO? Multiply blades per season by price, add changeouts multiplied by labor and downtime per changeout, and include an allocated inventory and risk allowance. Run the same calculation for each option.
Why is purchase price not the best comparison? Because the blade price drives other costs. A more expensive blade with fewer changeouts can have a lower seasonal TCO, which is the argument behind carbide edges.
What is the biggest mistake in TCO? Ignoring changeout labor and downtime, especially during storm windows, and using one average for all routes instead of route-level data.
How accurate does the data need to be? Better than a guess, and honest about assumptions. One season of changeout records by truck and route is enough to make TCO a management tool.
Does SENTHAI provide TCO data? SENTHAI states that carbide blades can deliver a service life 10 to 20 times longer than steel and argues for cost-per-mile, but the fleet’s own TCO number comes from its data, not the supplier’s claim.
What if the conservative case shows no savings? Then the decision is a pilot, not a purchase. Run the model conservatively, pilot on the worst routes, and let the trial data decide.
Can TCO be used for one route group instead of the whole fleet? Yes, and it should be. Splitting the fleet into high-wear and normal route groups reveals the trucks where a more durable edge pays back fastest, which a fleet-wide average hides. Run the model per group and act on the group that justifies the change.
Sources
Related articles
 Plow Skid Shoes vs Plow Feet: What They Do and How to Set ThemCore Topics
 What Is a Packed Ice Carbide Kit? The I.C.E. Blade System ExplainedCore TopicsCost-per-Mile for Plow Blades: A KPI Buyers Can Actually UseCore Topics
 Why Carbide Blades Crack in Deep Cold: Stress Relief, Brazing, and HandlingCore Topics