
Cost-per-Mile for Plow Blades: A KPI Buyers Can Actually Use
The blade price is a number on an invoice; the cost-per-mile is a number that survives budget season. It combines the blade price with the changeout labor, the downtime, and the miles the blade…
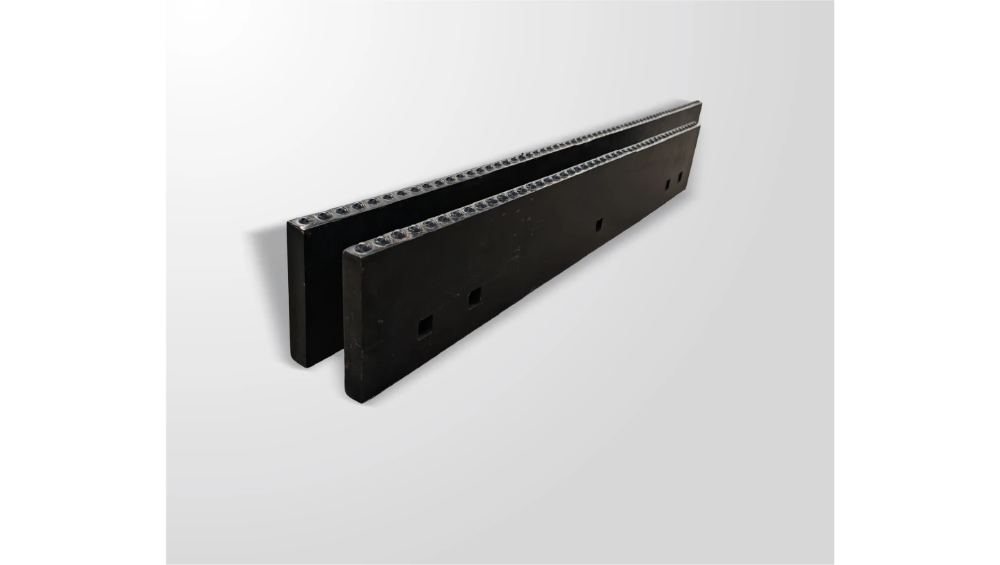
The blade price is a number on an invoice; the cost-per-mile is a number that survives budget season. It combines the blade price with the changeout labor, the downtime, and the miles the blade actually served, and it gives the fleet a single metric for comparing blades, routes, and seasons. It is the KPI that turns blade buying from a price discussion into a cost discussion.
This article explains how to calculate cost-per-mile, how to collect the data without new systems, how to benchmark across trucks and routes, and how to present the metric to leadership.
A KPI that survives budget season
Budget committees distrust blade prices that stand alone, because the price does not say what the blade costs to run. Cost-per-mile answers the question the committee actually asks: what did clearing this route cost per mile of blade service?
The metric has three properties that make it useful:
- It is comparable: the same formula works across trucks, routes, and blade types;
- It is fair: it includes the changeout cost, so a cheap blade that changes often does not look like a bargain;
- It is auditable: every input traces to a log, an invoice, or a labeled assumption.
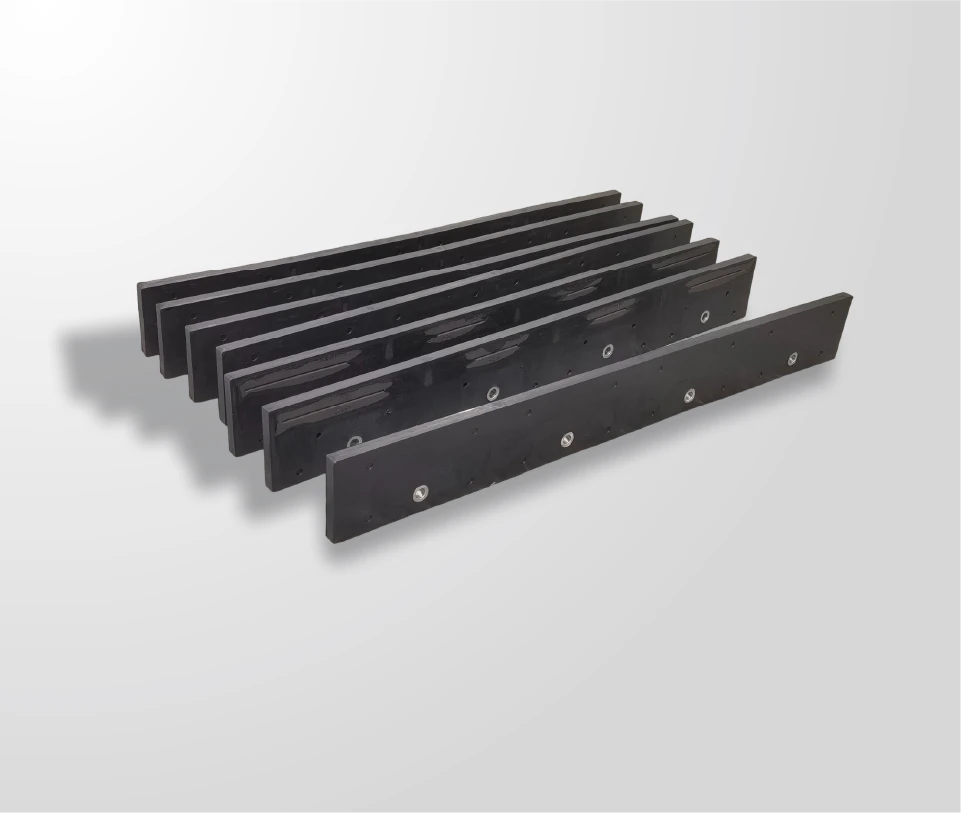
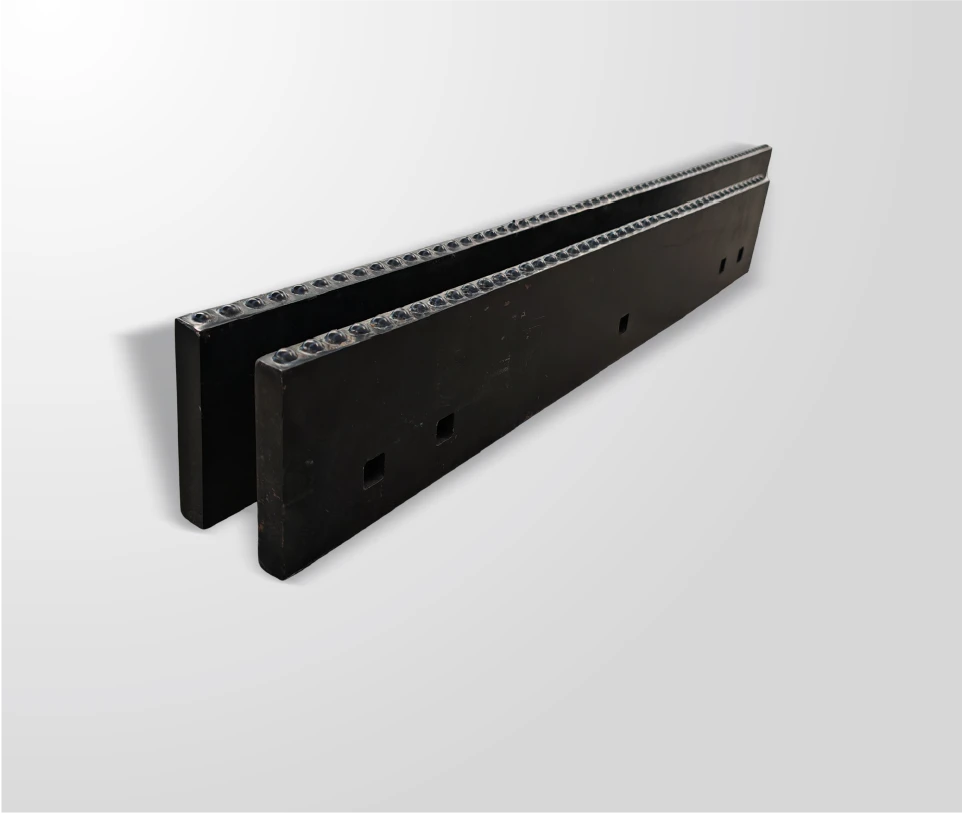
SENTHAI argues for exactly this frame on its carbide snow plow blade page: the true metric is cost-per-mile, not purchase price, because fewer changeouts mean lower labor and downtime. The argument is directional; the metric is the way to test it with the fleet’s own numbers.
How do you calculate cost-per-mile?
The formula is simple, and the definitions are the part that needs care.
Cost-per-mile = (Blade cost per season + changeout labor per season) / miles cleared per season
The components:
| Component | Definition |
|---|---|
| Blade cost per season | Number of blades consumed, times the unit price |
| Changeout labor per season | Changeouts, times the labor and downtime per changeout |
| Miles cleared per season | Route miles the blade actually served, recorded per truck |
The labor rate should be the loaded rate, and the downtime should be valued at what the truck would otherwise be doing. The definitions should be written down once and used consistently, because the metric is only comparable if the formula does not change between comparisons.
The illustrative example: a truck that uses six steel blades at $100 each, with six changeouts at $60 labor each, over 3,000 miles, runs at $0.32 per mile. The same truck with one carbide blade at $800 and one changeout at $60 labor runs at $0.29 per mile. The numbers are examples, not results; the structure is what transfers.
Collecting the data without new systems
The data already exists in the fleet’s records; the work is organizing it:
- The maintenance log has the changeout dates and labor hours;
- The invoice file has the blade prices;
- The route records have the miles;
- The fuel and contract records value the downtime.
The collection tool can be a spreadsheet with three sheets: one for changeouts, one for blade costs, one for miles. Assign one person to maintain it and review it monthly, and the metric becomes available at the season-end review without a new software project.
The discipline is the consistency: the same definitions, the same fields, the same review rhythm. A spreadsheet that is maintained is worth more than a system that is ignored.
How do you benchmark across trucks and routes?
The benchmark is where the metric earns its keep. Compare:
- The same blade type across route groups, to see where wear is fastest;
- The same route group across blade types, to compare the products fairly;
- The same fleet across seasons, to see the trend;
- The fleet against its own best-performing trucks, to find the practices that work.
The comparison is only fair when the conditions match: the same surface, speed, and abrasive load, or an adjustment for the difference. A highway truck will always show a different cost-per-mile than a residential truck; the benchmark’s job is to explain the difference, not to rank the trucks blindly.
The benchmark also surfaces the outliers: the truck with double the fleet’s cost-per-mile is either wearing edges abnormally or carrying a data error, and either finding is worth investigating.
The benchmark should be reviewed at a fixed point, ideally at the season-end review, so the comparisons are made on complete seasons rather than partial data. A mid-season glance is useful for catching problems, but the formal benchmark belongs to the review, where the routes, the storms, and the conditions can be compared fairly.
The benchmark should also be shared with the maintenance team, not just the leadership. The shop that sees its cost-per-mile compared across trucks will find the installation errors, the operator habits, and the route assignments that drive the difference, because the metric tells them where to look. The metric is a management tool at the top and a diagnosis tool in the shop; both uses need the same data.
The metric also has a place in the supplier conversation. When a supplier claims a longer service life, the fleet can ask the claim to be framed in cost-per-mile terms and compare it against the baseline the fleet already holds. The supplier that engages with the metric instead of the price is the supplier that understands the buying decision, and the comparison produces the number the budget needs.
The metric also has a discipline value: it forces the fleet to count the miles, the changeouts, and the labor, and the counting is what makes the whole blade program visible. A fleet that cannot produce its cost-per-mile cannot defend its blade spending, and the metric is the discipline that builds the defense.
The defense, once built, survives the budget review and the supplier presentation alike.
The number, once measured, speaks for the fleet.
And the measurement is the whole method.
The method is the fleet’s own.
And the fleet owns the number it measures.
The most common mistake is changing the formula between comparisons. If the labor rate, the downtime value, or the mile definition changes from one season to the next, the numbers are not comparable, and the benchmark becomes a false comparison. The definition sheet, written once and kept stable, is what protects the metric’s meaning across seasons.
Presenting the metric to leadership
The presentation should lead with the metric and the comparison, not the method:
- One line for the current cost-per-mile and the trend;
- One table comparing the blade options on the same routes;
- One statement of the savings opportunity and the payback logic;
- One recommendation for the pilot or the change.
The supporting detail, the formula, the logs, and the assumptions, goes in the appendix. Leadership wants the conclusion and the evidence path, not the arithmetic session.
The metric also protects the presenter: a recommendation built on cost-per-mile is a recommendation built on the fleet’s own data, which is harder to dismiss than one built on a supplier brochure.
Start measuring with your next order
The metric starts with the log, not with the purchase. Begin recording changeouts, labor, and miles this season, and the next order will have its first cost-per-mile comparison. The cost-per-mile blade reference is the product reference, and the contact page is where the specification conversation starts.
The KPI belongs to the fleet, and it is the number that survives the budget meeting, the supplier presentation, and the season-end review. Measure it once, and blade buying changes from a price decision to a cost decision.
Expert view — SENTHAI engineering team: “Cost-per-mile is the number that survives the budget meeting. The formula, kept stable, is the fleet’s evidence.”
Frequently Asked Questions
What is cost-per-mile for plow blades? It is the seasonal blade cost plus changeout labor, divided by the miles the blade served. It is the KPI that combines price and running cost.
How do I calculate it? Add the blade cost per season to the changeout labor per season, then divide by the miles cleared. Write the definitions down and use them consistently.
Why is cost-per-mile better than blade price? Because it includes the changeout cost. A cheap blade that changes often can cost more per mile than a durable one.
What data do I need? The maintenance log for changeouts and labor, the invoices for blade prices, and the route records for miles. A three-sheet spreadsheet is enough.
How do I benchmark fairly? Compare on matched conditions: the same route group across blade types, or the same blade across route groups, with the surface and speed accounted for.
How should I present the metric? Lead with the current value, a comparison table, the savings opportunity, and a recommendation. Put the formula and the logs in the appendix.
Does SENTHAI provide cost-per-mile data? SENTHAI argues that cost-per-mile is the right metric and states its blades deliver fewer changeouts; the fleet’s own calculation produces the number.
Sources
Related articles
 Plow Skid Shoes vs Plow Feet: What They Do and How to Set ThemCore TopicsWhat Is a Packed Ice Carbide Kit? The I.C.E. Blade System ExplainedCore Topics
 Why Carbide Blades Crack in Deep Cold: Stress Relief, Brazing, and HandlingCore Topics
 JOMA-Style vs Rigid Carbide Blades: Matching the Edge to the RouteCore Topics