
Plow Blade Cost Per Mile: The Inputs That Decide the Answer
Plow blade cost per mile explained through its inputs: what to measure, what to exclude and how to model edge options per truck group rather than per fleet.
Cost per mile is the most quoted number in edge procurement and the least often built from measured inputs. Most fleets inherit a figure from a previous spreadsheet, update the purchase price and leave the interval unchanged, which produces a calculation that looks precise and describes nothing. The useful work is not the arithmetic but deciding which inputs to measure, and the answer changes when the inputs change rather than when the price does.
Plow Blade Cost Per Mile: What the Model Has to Deliver
It has to make two options comparable on one basis.
The model exists to convert purchase price, interval, labour, downtime risk and machine load into a single figure that can be compared across edge options and truck groups without an argument about which factor matters more.
That purpose sets the design. A model built only from parts cost will always favour the cheaper edge, because the savings from a longer interval land in labour and downtime, which sit outside the parts line. A model that includes everything but uses an assumed interval simply automates the assumption. The version that helps a fleet is the one whose inputs are recorded in service and whose output can be recalculated as those records accumulate.
Scope matters too. Running the model for the fleet as a whole averages away the differences that decide the purchasing question, because carrier class and route type change the interval enough to reverse the ranking between edge options. The model should be run per truck group, and the groups should be the same ones used for specification and standardisation. The general approach is set out on the cost per mile page; this article covers what to feed it.
How the Inputs Differ Between Edge Options
The inputs move in different directions for different edges.
A steel edge reduces purchase price and multiplies replacement events. A carbide edge raises the purchase price and reduces the number of events. A flexible segmented blade changes the replacement unit and adds parts to track. Each shift lands in a different line of the model.
Purchase price is the input fleets know best and the one that matters least on its own, because it is paid once per replacement event rather than once per season. Interval is the input that carries the most weight, and it is the one most often assumed. Labour per change is straightforward to record if workshop time is tracked by task. Downtime risk is harder to quantify but can be represented simply: the probability that a change falls inside a storm cycle, multiplied by the cost of that event, which is usually a judgement made explicit rather than a calculation.
Machine load is the input most often omitted and the one that changes conclusions on obstruction-heavy routes. Down-pressure applied to compensate for lost contact loads the trip mechanism, shoes and mountings, and the resulting workshop hours belong in the model even though they appear in a different budget line. Where a specification reduces those interventions, excluding the saving biases the comparison against it.
Specification Inputs You Need Before Modelling Plow Edge Cost Per Mile
Five inputs should be settled before any arithmetic starts. The truck groups with their patterns and carrier classes. The route classes each group runs, with surface mix and whether refrozen conditions recur. The current specification in force, including edge type, grade and dimensions. The measured replacement interval, taken from records rather than from memory. And the labour and downtime assumptions the fleet is prepared to stand behind.
Where the measured interval does not exist yet, the first season of records is the model’s input rather than its output. That is a legitimate starting position: model with an assumed interval now, record carefully through the season, and recalculate. The risk is forgetting the second step, which leaves a model built on an assumption and a fleet arguing about a number nobody measured.
Route classification should be simple enough to apply consistently. Surface type, road class and whether the route holds refrozen snow are usually sufficient to separate groups whose intervals differ. Complexity beyond that produces categories that nobody applies uniformly, and inconsistent classification undermines the comparison.
One further input is worth adding because it costs nothing to collect: the reason an edge was removed. Retired for wear, retired after damage, or retired because the season ended are three different events, and only the first belongs in an interval calculation. Where damaged edges are counted alongside worn ones, the model records a maintenance failure as a wear result and the comparison against a different edge option becomes misleading.
Fitment, Hardware and Installation Consequences in the Plow Edge Cost Per Mile Model
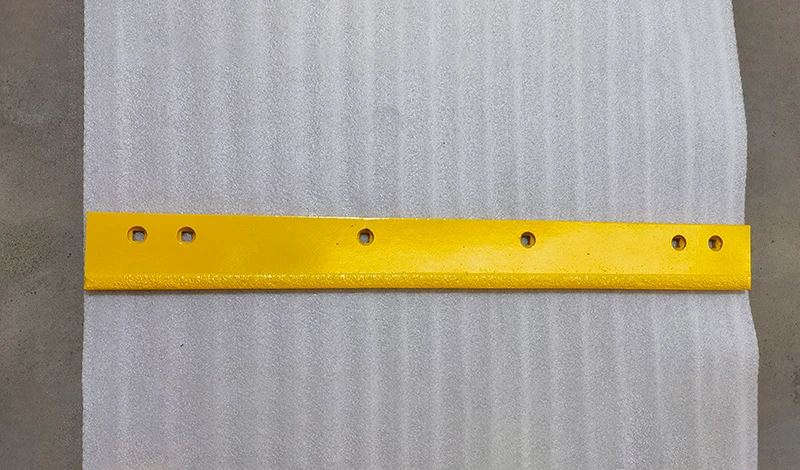
Installation inputs belong in the model because they change with the specification. A heavier edge may require longer bolts or different washers, and a segmented blade changes the number of components handled per change. SENTHAI validates fitment against AASHTO and DIN bolt patterns before release and works to plus or minus 0.02 mm dimensional tolerances on carbide components, with AASHTO published standards as the reference for agency specifications and DIN covering European and export conventions.
Three installation inputs are worth recording separately. Parts and hardware consumed per change, workshop hours per change, and any change in the time the vehicle is out of service. Where a fleet moves between edge types, those three inputs usually differ, and combining them into a single labour figure hides the difference that matters.
Fitment failures should also be represented, because they are a real cost and a preventable one. An edge that does not seat correctly, or that requires the mounting holes to be dressed before fitting, consumes workshop time that a correctly specified and validated edge would not. Recording fitment issues as an input over a season gives the fleet a measurable reason to require written fitment confirmation from suppliers, which is a cheaper intervention than a mid-season rework.
Cost Per Mile Inputs: What to Include and What to Leave Out
The model should include purchase price per unit, the number of replacement events per group per season, labour per change, hardware and consumables, downtime risk and machine-load consequences. It should exclude anything the fleet cannot observe or influence, because unobservable inputs make the output unchallengeable in both directions.
| Input | How to record it | Why it matters |
|---|---|---|
| Purchase price per unit | From quotation, against the written specification | Sets the starting point but not the answer |
| Replacement events per group per season | From edge records, not estimates | Multiplies or divides every other input |
| Labour per change | Workshop hours recorded by task | Where the saving from a longer interval lands |
| Hardware and consumables | Stores issues per change | Differs between edge types and mounting requirements |
| Downtime risk | Proportion of changes falling in storm cycles | Captures the cost of a change at the wrong time |
| Machine-load consequences | Hardware interventions and trip mechanism work | Often the reason a cheaper edge is more expensive |
Two cautions belong with the table. First, the interval is an input, not a result, and a model that fixes it in advance cannot show whether a specification changed anything. Second, the model should be recalculated at the same time each season, using the same definitions, so the comparison between years is meaningful. Where definitions shift, the year-on-year output measures the definition rather than the fleet.
Documentation That Makes the Plow Edge Cost Per Mile Model Auditable
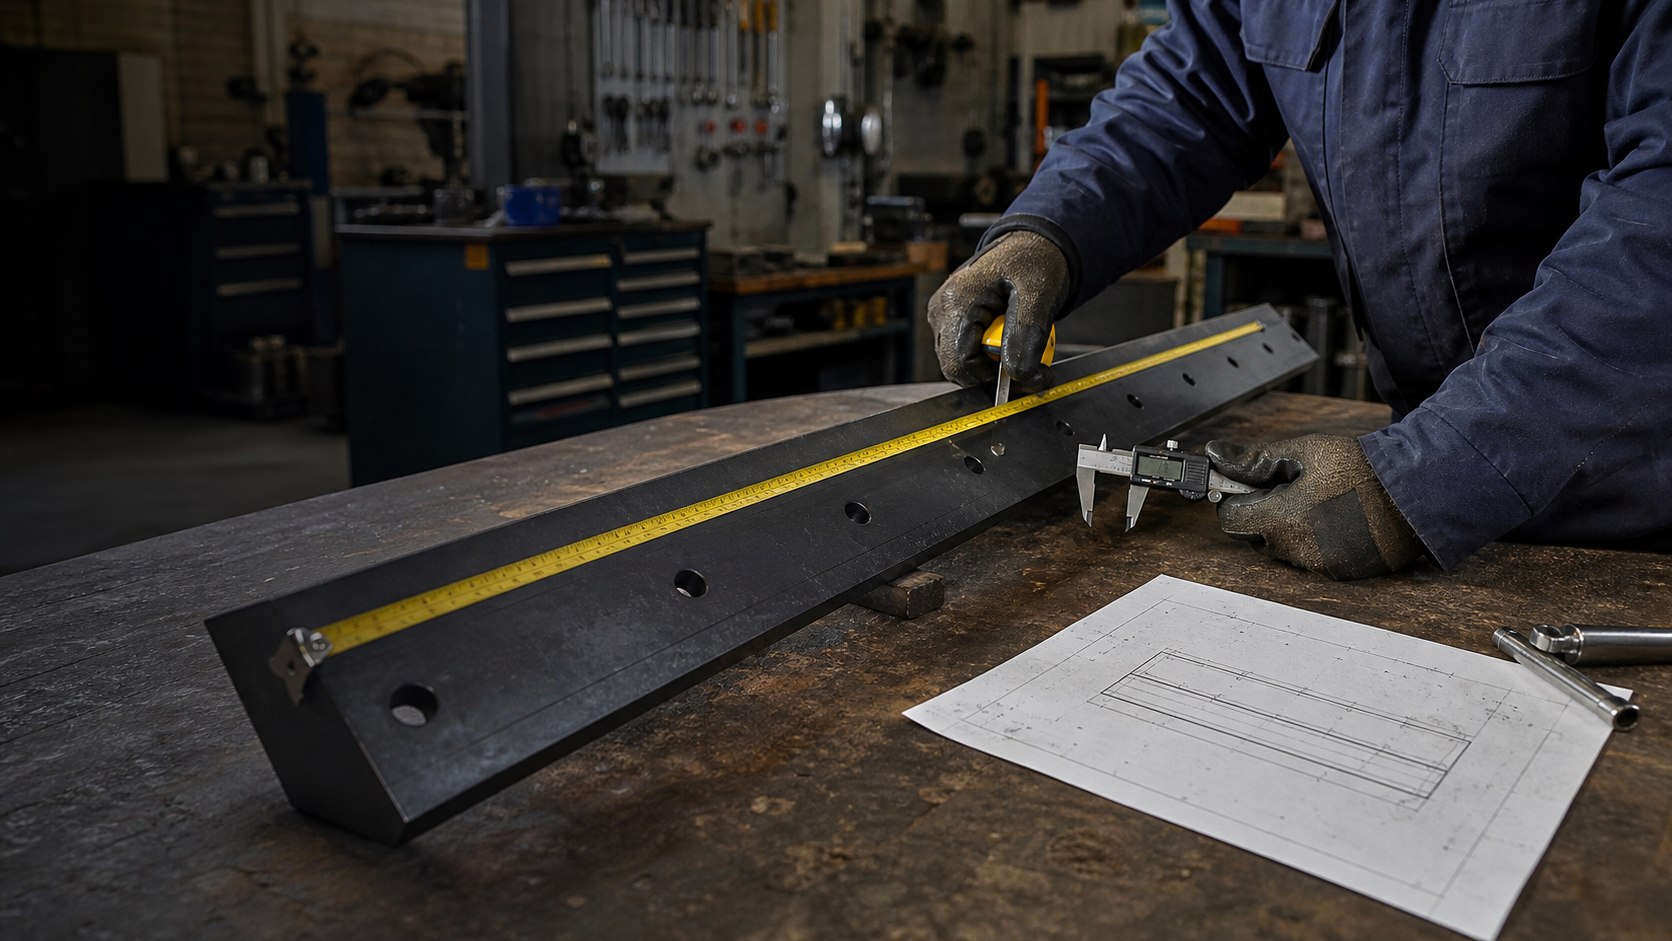
A model is only as good as the documents behind its inputs. Quotations should reference the specification they were priced against, so that a price change can be attributed to a specification change rather than absorbed silently. SENTHAI inspects and archives every batch, which means a delivery can be traced to the grade and tolerances it was produced to; the quality control and traceability page describes what those records contain.
Where a public programme is involved, the procurement framework adds its own documentation requirements, and supplier registration for federal awards is handled through SAM.gov while general procurement guidance is published by GSA. Keeping the technical documentation and the commercial documents together is what allows a model to be reviewed by someone who was not involved in building it, which is usually the test that matters in an audit.
Reorder and Continuity Planning Against the Plow Edge Cost Per Mile Model
The model’s second output is the reorder point. Once the interval and the number of units per group are known, the quantity the fleet needs to hold becomes a calculation: consumption per group across the season, adjusted for the weeks when replacements cluster. That figure is more useful than a percentage of fleet size, because it follows the work rather than the vehicle count.
Continuity also depends on specification stability. Where a specification changes between orders, the interval changes with it and the model needs rebuilding. Keeping the specification revision attached to the group record, and requiring follow-on orders to be produced to the same revision, is what keeps the model valid from one season to the next.
Finally, set the review date when the model is created. Winter maintenance conditions published by the Federal Highway Administration and the pooled research published by Clear Roads are useful references when comparing a season against expectations, because they give the fleet a basis for discussion that is external to the parties negotiating the next order.
Cost per mile is decided by its inputs, and the inputs that matter most are the ones fleets are least likely to have measured: the interval, the labour per change and the machine-load consequences of poor contact.
Build the model per truck group, record the interval rather than assuming it, and recalculate it on the same definitions each season. Run that way, the number becomes a management tool that survives review instead of a figure carried forward from a previous spreadsheet.
Send SENTHAI your truck groups, route classes and one season of replacement records, and the technical team will work through the cost per mile inputs against the specification each group currently runs.
Frequently Asked Questions
What is the single most important input in a cost per mile model?
The replacement interval, because it multiplies every other input. Purchase price is paid once per event, so the number of events across a season decides whether a cheaper edge is actually cheaper. Where the interval is assumed rather than measured, the model describes the assumption. One season of recorded replacement dates and metres plowed is enough to replace it with data.
Should downtime be included in the calculation?
Yes, in a simple and explicit form. The practical approach is to record the proportion of changes that fall inside a storm cycle and to agree a cost for that event with the operations team. Making the assumption explicit allows it to be challenged and adjusted, whereas omitting downtime entirely systematically favours the edge that has to be changed more often.
How often should the model be recalculated?
Once a season is usually enough, provided the definitions used are identical each time. Recalculating more often than the interval data changes produces noise rather than information. Where a specification change is made, recalculate for the affected group at the next review so the change can be evaluated against the previous specification on comparable inputs.
Why run the model per truck group rather than for the whole fleet?
Because carrier class and route type change the interval enough to reverse the ranking between options. A fleet-level average hides those differences and produces an answer that is correct for no individual group. Running the model per group also produces an output that matches the specification and standardisation decisions, so one set of records supports all three.
Related articles
 Plow Blade Supplier Comparison: The Documentation That Decides ItSnow plow blade programme & selection
 Municipal Plow Blade Bid Specification: Writing the Technical SectionSnow plow blade programme & selection
 Plow Blade Wear Measurement: When to Replace and When to RotateSnow plow blade programme & selectionFleet Plow Blade Standardisation: Cutting the Cost of VariationSnow plow blade programme & selection