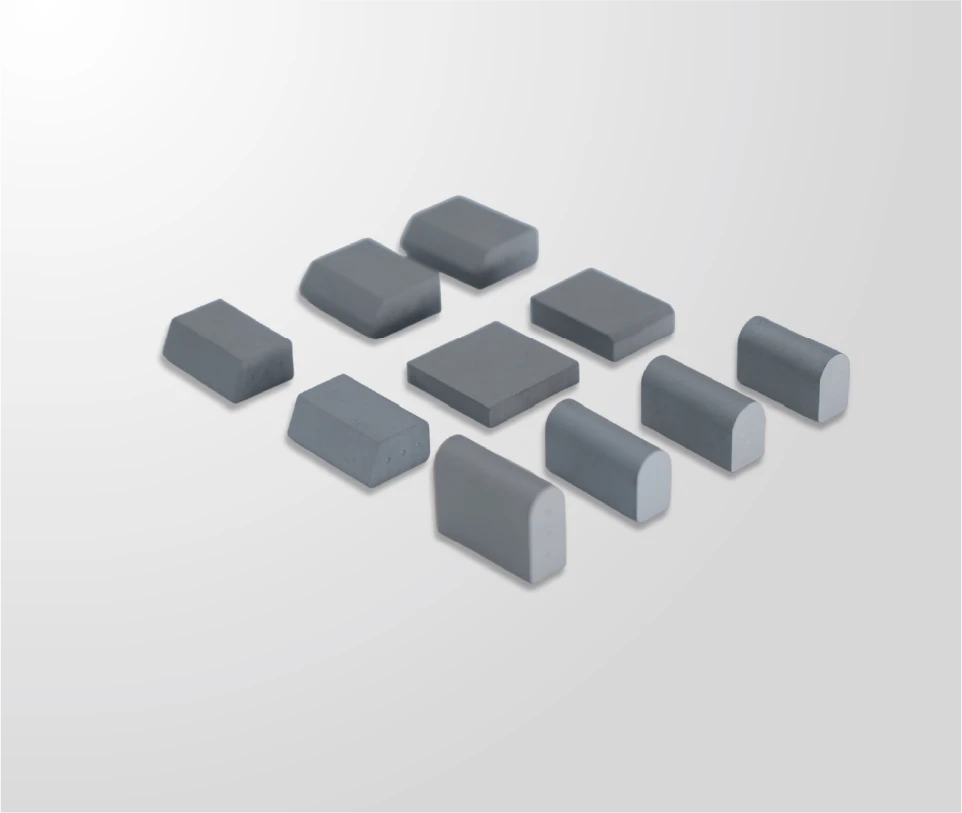
JOMA Blade Cost Modelling for Segment Programmes
JOMA blade cost modelling for segment programmes: the inputs that decide the case, how segmented and continuous edges differ and what to measure.

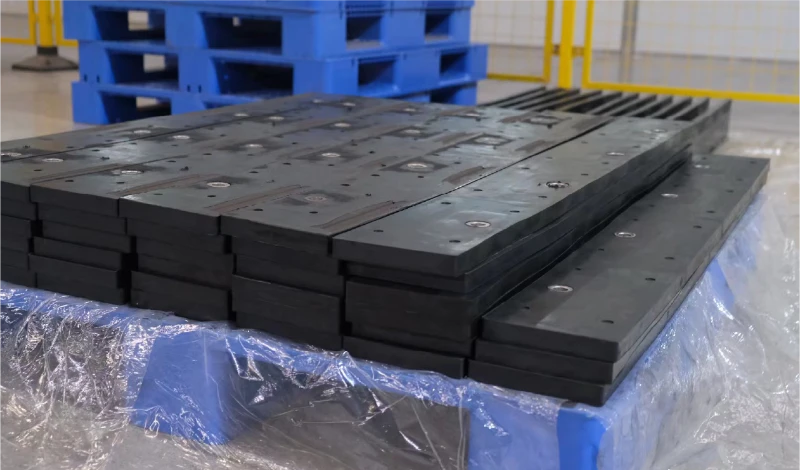
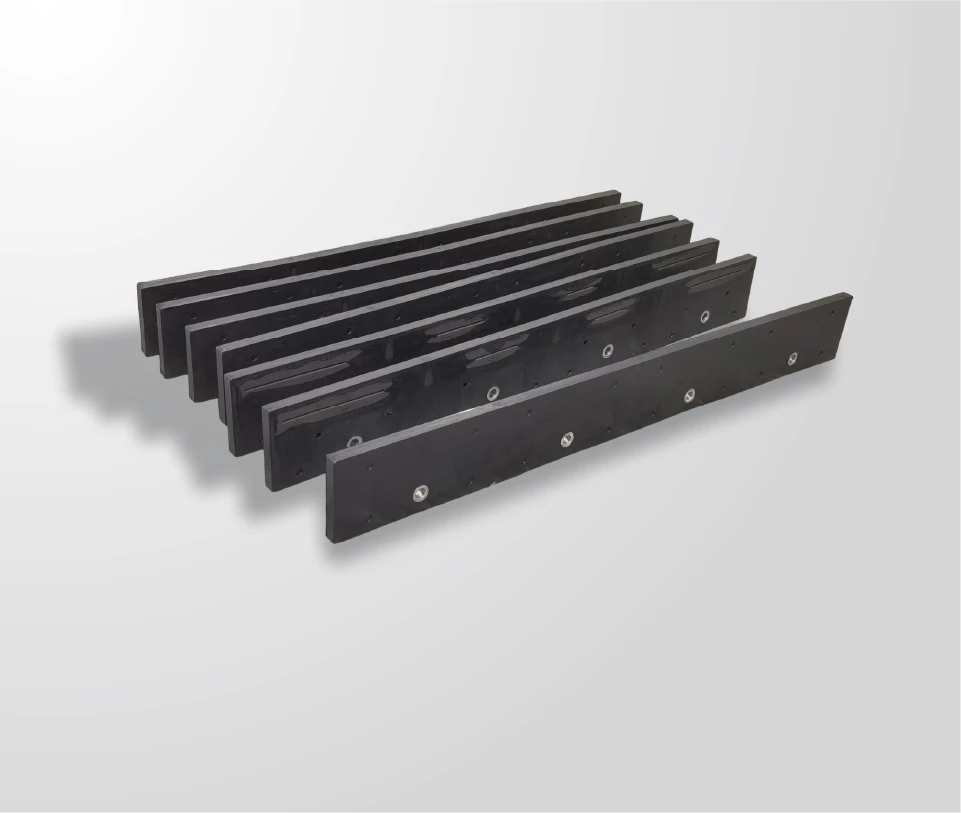
Segmented blades change the shape of the cost model rather than the total. Instead of buying edges, a fleet buys segments; instead of replacing a whole working face, it replaces sections; and instead of one interval per blade, it has one per position. Those differences mean a model built for continuous edges will misstate the case for a segmented programme in both directions.
What a JOMA Blade Cost Model Has to Deliver
It has to price the section, not the assembly.
The model has to reflect that a segmented programme replaces parts of a blade, that different positions consume material at different rates and that the labour involved is different from changing a single edge.
That means the unit of analysis changes. A continuous edge model works on one interval per blade; a segmented programme works on a distribution of intervals across positions, with the assembly’s practical life set by whichever position reaches its threshold first. Modelling the average across positions therefore overstates the life of the blade and understates the consumption of the worst slot.
The general cost framework is set out on the cost per mile page, and applying usage data to interval planning is the subject of the material on telematics and JOMA blade wear life. Running the two together is what produces a segmented model that describes the fleet’s actual experience.
How Segment Programmes Differ in Cost and Service
Three differences matter. First, the material retired per event is smaller, because a worn section is replaced on its own rather than as part of a whole edge. Second, the labour is more granular: more frequent, smaller interventions rather than fewer large ones. Third, rotation is available, which uses remaining material across positions and extends the practical life of the assembly.
A fourth difference is the spares structure. A continuous edge programme holds one part number per blade specification; a segmented programme holds segments that may be interchangeable across positions, and the holding has to reflect consumption by position rather than by blade. That makes the holding smaller and more precise, provided the position record exists.
Those differences cut in both directions. Smaller replacement units reduce the cost of each event, but more events mean more workshop touches. Rotation extends assembly life but requires a position record and the discipline to act on it, which is a labour cost that is easy to omit from a model and then discover in practice.
The comparison that matters is therefore against a continuous edge on the same routes, not against a purchase price. Where a fleet’s routes produce localised wear, the segmented model usually shows a lower material cost per metre because only the worn sections are retired. Where wear is even across the working width, the advantage narrows, and the deciding inputs become labour and the discipline of record keeping.
Specification Inputs You Need Before Modelling a Segment Programme
Six inputs are needed before any arithmetic. The segment arrangement on each truck group, including the number of positions. The measured interval at each position, from the fleet’s own records. The cost of a replacement segment and the hardware consumed with it. The workshop hours per replacement, recorded by task. The route classes each group works. And the labour and downtime assumptions the fleet is prepared to stand behind.
Two further inputs improve the model. The rotation pattern actually used, since a fleet that rotates will consume positions differently from one that does not. And the reason each segment was removed, separating wear from damage and from deformation, because only wear belongs in an interval calculation.
Where records do not exist, the first season is the measurement phase. Fit the arrangement to a defined group, record per position and per cause, and build the model from the data the following year. SENTHAI inspects and archives every batch and works to plus or minus 0.02 mm dimensional tolerances on carbide components, so a segment’s history can be checked against the drawing it was produced to, with pattern references published through AASHTO and DIN.
Fitment, Hardware and Installation Consequences for Segment Programme Cost Modelling
Installation inputs belong in the model because a segmented blade involves more positions. Each segment has its own fasteners, its own seating check and its own place in the tightening sequence, so the labour per event is different from changing a single edge. SENTHAI validates fitment against AASHTO and DIN bolt patterns before release, and where an OEM mounting interface is involved, SAE standards for mobile machinery describe the interfaces those designs were built around.
Three inputs should be recorded separately rather than combined. Segments and hardware consumed per event, workshop hours per event and any change in vehicle downtime. Combining them into one labour figure hides the difference that matters in a busy week, when downtime rather than parts cost decides whether the fleet meets its commitments.
Fitment problems should appear as their own line, because a segmented blade makes them more likely rather than less: more positions, more joints and more opportunities for a segment to sit incorrectly. Recording those events gives the fleet a measured basis for requiring written fitment confirmation and inspection data with each delivery, and it identifies whether the problem is the segment or the mounting face.
The mounting face deserves its own place in the model as well. It wears as successive segments are clamped against it, and after enough cycles it no longer seats them accurately. That cost is shared across several sets of segments, so it belongs with the body rather than with the segment line, and a model that omits it will overstate the number of segment sets a blade can carry.
JOMA Blade Cost Model: What to Include
The model should include segments per blade, cost per segment, replacement frequency by position and by cause, workshop hours per event, hardware consumed and the downtime risk of an event falling inside a storm cycle. It should exclude anything the fleet cannot observe, because unobservable inputs make the output impossible to challenge in either direction.
| Input | How to record it | Why it matters |
|---|---|---|
| Segments per blade | From the arrangement drawing | Sets the material content of each assembly |
| Cost per segment | Quotation against the written specification | Starting point only |
| Interval by position | Measured readings per slot | Shows how unevenly the assembly is consumed |
| Rotation practice | Documented pattern in use | Changes consumption across positions |
| Workshop hours per event | Recorded by task | Where a cheaper segment can become expensive |
| Hardware and consumables | Stores issues per event | Recurs with every position replaced |
| Downtime risk | Proportion of events in storm cycles | Captures the cost of timing |
Two cautions belong with the table. The interval is an input, not a result, and where the model uses an average across positions it will understate consumption at the worst slot and overstate the life of the assembly. And the model should be recalculated at the same point each season with the same definitions, so the comparison measures the fleet rather than the spreadsheet.

Documentation That Makes a Segment Programme Model Auditable
Each input should be traceable to a document. Quotations should reference the specification they were priced against, so a price change can be attributed to a specification change. SENTHAI inspects and archives every batch, which means a delivery can be traced to the grade and tolerances it was produced to; the quality control and traceability page describes that record.
Grade claims should be checkable against published methods such as those from ASTM. Where the programme is publicly funded, supplier registration for federal awards is handled through SAM.gov, and general procurement guidance is published by GSA. Keeping technical and commercial documents together allows the model to be reviewed by someone who did not build it, which is usually the standard it will be held to.
Two external references help when a review has to explain a season that did not match expectations: the winter operating context published by the Federal Highway Administration and the pooled maintenance research published by Clear Roads.
Reorder and Continuity Planning Against a Segment Programme Model
The model’s second output is the holding. For a segmented programme it is calculated per position rather than per blade: the number of segments consumed in each slot across the season, adjusted for the weeks when replacements cluster and for lead time. That figure is more precise than a fleet-wide rule and smaller than a holding based on worst-case assumptions.
Continuity depends on specification stability. Where the arrangement, grade or segment size changes between orders, the intervals change with it and the model needs rebuilding. Keeping the drawing revision attached to the group record, and requiring follow-on orders to be produced to it, is what keeps the comparison valid. Releases and spare segments are available through the JOMA style replacement blade range.
Finally, set the review date when the model is created. A segmented programme reviewed after the season, against criteria agreed before it, produces a decision the following year can rely on. Where the review shows that rotation reduced consumption at the worst slot, the practice is worth extending; where it shows that wear is even across positions, rotation is effort without benefit and the model should record that too, because a practice that does not pay should be visible rather than assumed.
A JOMA blade cost model for a segment programme works per position rather than per assembly. Material retired per event is smaller, workshop interventions are more frequent, and rotation is an available saving that only exists if the fleet records and acts on position data.
Model it per group and per slot, record the reason for every replacement and recalculate on the same definitions each season. Run that way, a segmented programme can be compared fairly against a continuous edge and the holding can be sized from consumption rather than from caution.
Send SENTHAI your segment arrangement, position records and one season of maintenance data, and the technical team will work through the cost model inputs for each group.
Frequently Asked Questions
Why is a segmented blade costed per position rather than per blade?
Because positions consume material at different rates. The assembly’s practical life is set by whichever position reaches its threshold first, so an average across positions understates consumption at the worst slot and overstates the life of the blade. Recording intervals per position also shows where rotation will produce savings.
Does rotation belong in the cost model?
Yes, because it changes how material is consumed across positions and extends the practical life of the assembly. It also carries a labour cost, which is easy to omit and then discover in practice. Record whether rotation is actually performed, not whether it is planned, since a rotation policy that is not executed has no effect on the numbers.
How should workshop hours be recorded for a segmented programme?
By task, per event, rather than as a running total. Segment replacement is a specific activity with its own duration, and combining it with other workshop time hides the difference between arrangements. Where hours cannot be recorded accurately, use a consistent estimate per event and state it as an assumption so it can be improved later.
What should trigger a review of the model?
A change of arrangement, route assignment or specification revision, or a season in which consumption differed materially from the estimate. Each of those changes an input the model was built on. Reviewing once a season keeps the numbers aligned with the work rather than carrying forward a figure set under different conditions.