
Faster Ice Breaking, Safer Roads: The Safety Case for Carbide Kits
Safety in winter maintenance is measured in minutes. The time it takes to clear an ice-bonded corridor is the time drivers, emergency vehicles, and transit users are exposed to the risk, and a blade…
Safety in winter maintenance is measured in minutes. The time it takes to clear an ice-bonded corridor is the time drivers, emergency vehicles, and transit users are exposed to the risk, and a blade that breaks the ice on the first effective pass is a blade that shortens that exposure. The safety case for carbide ice-breaking kits is built on that link between clearing speed and risk.
This article explains how ice-clearing speed affects risk, the broader effects beyond crashes, how to build the safety case for the investment, and how a city can measure the outcomes.
Safety is measured in minutes
An iced corridor is a risk event with a clock. Every minute the ice stays bonded is a minute the road is hazardous, and the maintenance operation’s job is to compress that window: clear the ice sooner, and the exposure shrinks.
The blade’s role in the clock is the pass count. A scraping edge that cannot break the crust forces repeated passes, each one adding time and chemical. A fracture-capable edge breaks the ice mechanically on the pass available, which is the difference between a corridor cleared in one effective run and one cleared after several.
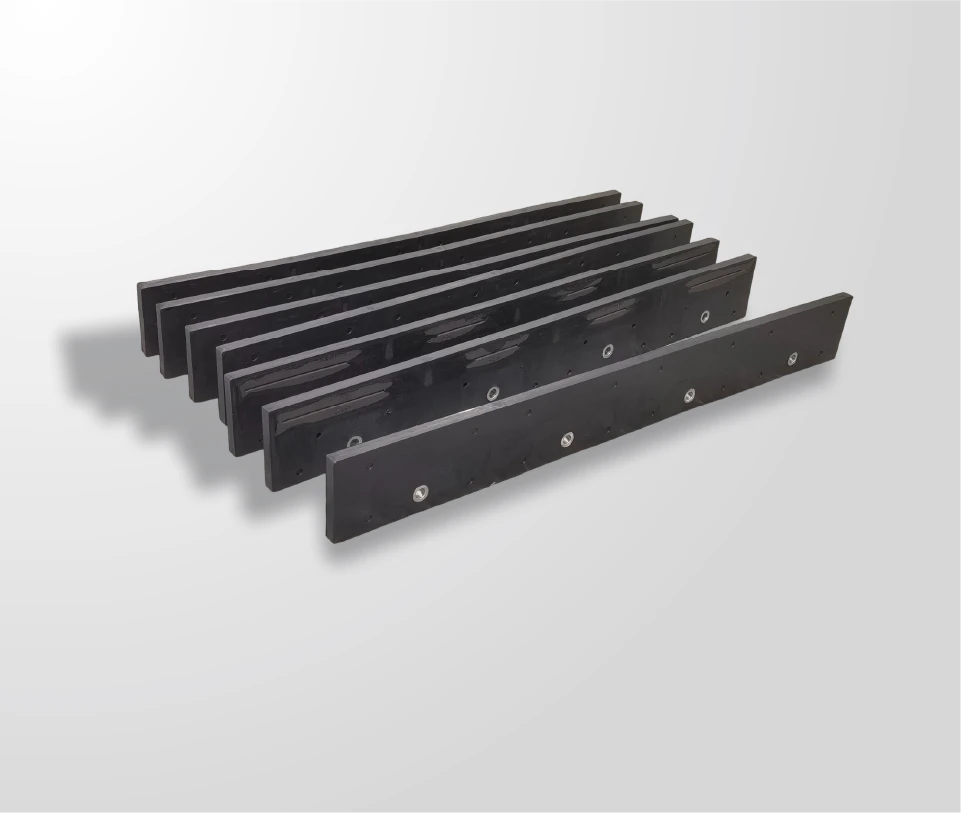
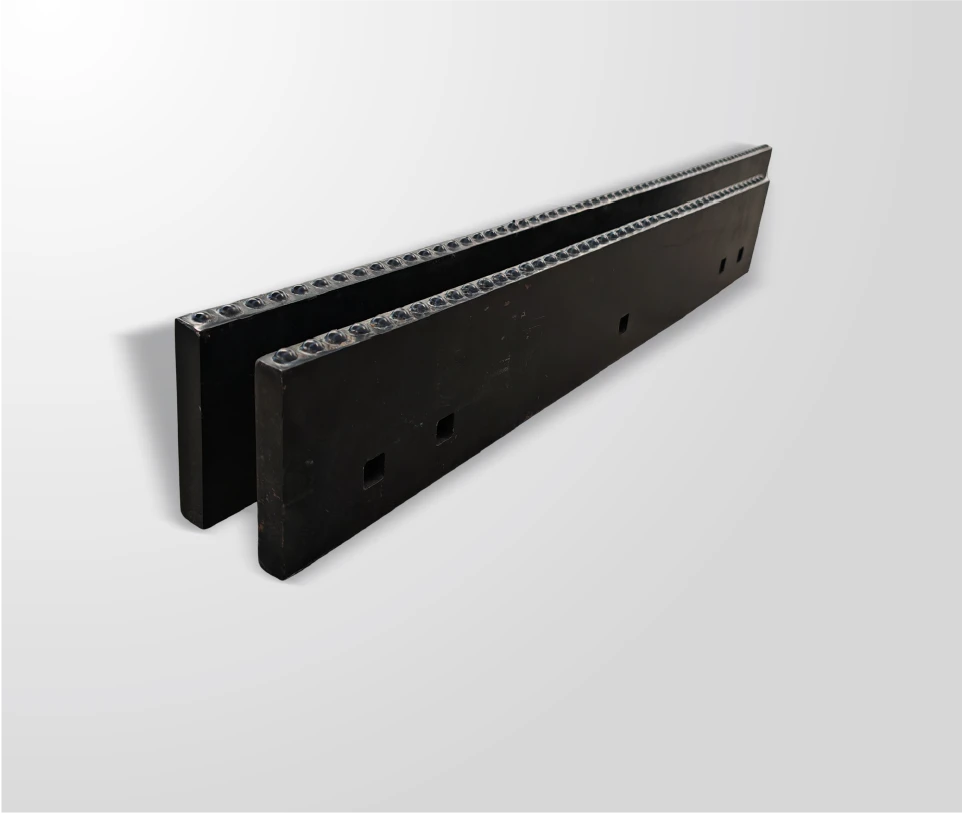
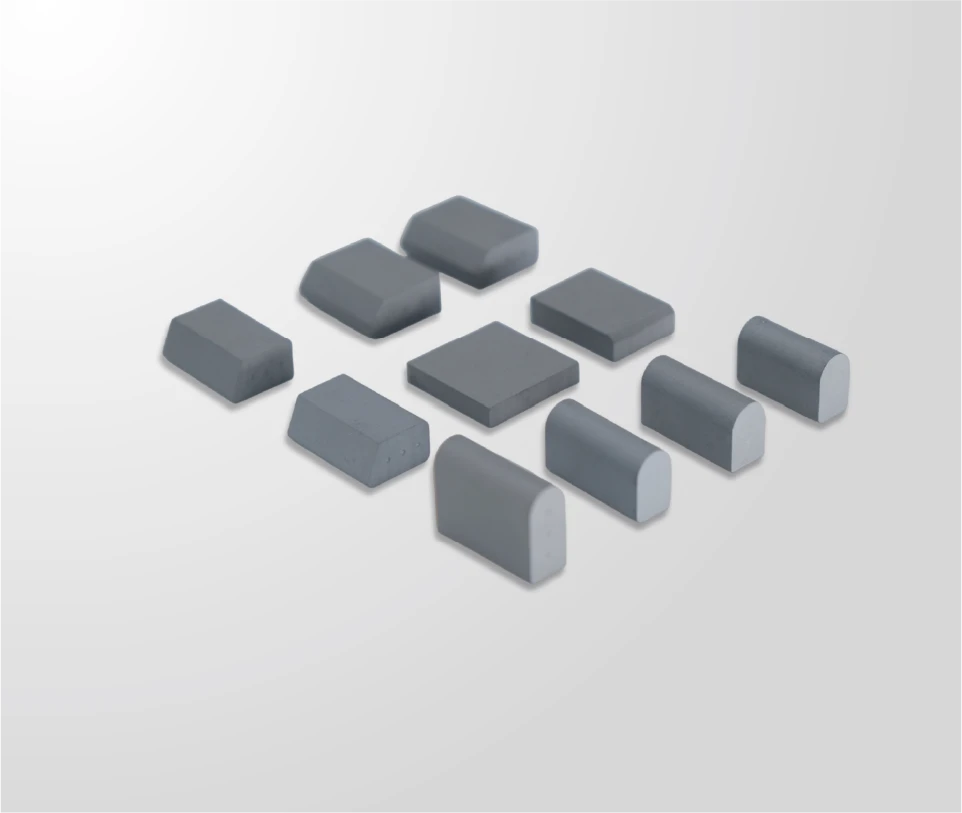
SENTHAI’s packed ice carbide kit is built for that difference: dome-head geometry that fractures the crust and an isolated insert design for repeated high-speed work. The safety argument is the minutes the kit saves on the corridors where it is assigned.
How does ice clearing speed affect risk?
The link between clearing speed and risk runs through several mechanisms:
| Risk mechanism | How clearing speed affects it |
|---|---|
| Traction | Bonded ice removes the grip; every minute of ice is reduced traction |
| Stopping distance | On ice, stopping distances grow for every vehicle on the corridor |
| Predictability | A bare-pavement road is predictable; an icy patch is a surprise |
| Response access | Clearing time is the response delay for emergency vehicles |
| Secondary effects | A crash on an icy corridor blocks the road and creates a secondary hazard |
Each mechanism is a reason the clearing time matters, and the blade that shortens the clearing time shortens all of them.
The risk link also explains why the safety case is corridor-specific. A residential loop and a hospital access road carry the same ice risk but very different consequences, and the corridor that serves the hospital earns the fracture-capable edge first. The prioritization is the safety case’s structure: the consequence, not the route length, sets the priority.
The same structure protects the measurement. A city that measures the clearing time on the high-consequence corridors, before and after the kit, has a safety result; one that averages all corridors has a number that hides the corridors that matter.
The safety case should also be communicated to the public in the right terms. A city that explains the clearing strategy, the priority corridors, and the measured result builds confidence, while one that stays silent leaves the residents to judge by the worst route. The communication is part of the safety program, not a separate office function.
The communication also supports the budget: a council that has seen the corridor-level safety data is a council that understands the purchase. The safety case, presented with the minutes and the routes, is the budget case in the language of the decision.
The safety case should also be honest about the limits: the blade shortens the clearing time, but it does not remove the need for the rest of the program, the chemicals, the routing, and the crew. The case that acknowledges the system, and the blade’s place in it, is the case that survives scrutiny.
The same honesty protects the measurement: a city that reports the clearing-time improvement alongside the unchanged factors builds the credibility that the next season’s data needs. The safety case is a system claim, and the system is the honest frame.
The frame, kept honest season after season, is what makes the safety program a public trust rather than a one-year argument.
The trust, earned in minutes, is the program’s lasting asset.
The minutes are the city’s own measure.
The measure, kept honestly, is the safety record.
The record is the city’s proof, season after season.
The proof is the program’s reputation.
The reputation is earned corridor by corridor.
And the corridor is the measure.
How long before the safety results show? The clearing-time data shows within the first season on the equipped corridors. The crash and incident data is a longer trend, and the responsible presentation treats it as a trend, not a one-season claim.
Beyond crashes: delays and access
The safety case is not only about crashes; it is about the operation of the whole city:
- Commute delay: an icy corridor slows traffic even without a crash, and the delay has an economic cost;
- Transit reliability: buses that cannot hold traction fall behind schedule, and the schedule failure affects riders;
- Access to services: hospitals, schools, and essential facilities depend on clear access, and the ice delays that access;
- Economic activity: freight and delivery routes lose time to the ice, and the time is money;
- Public confidence: a city that clears its worst corridors quickly builds trust, and one that leaves them icy earns complaints.
The broader effects are the reason the safety case should be presented in operational terms, not just crash statistics: the clearing speed affects the city’s daily function, and the blade is part of that function.
Building the safety case for investment
The safety case for a carbide kit is built on the corridor and the minutes:
- Identify the corridors where ice forms fastest and the consequences are highest;
- Document the current clearing time per corridor and the pass counts;
- Estimate the time the fracture-capable edge could save on those corridors;
- Frame the saving as reduced exposure, reduced delay, and reduced chemical use;
- Present the investment against the corridor-level benefit, not a fleet-wide average.
SENTHAI states that its packed ice kit can allow a significant reduction in salt application, often by up to 25–40%, and the chemical reduction is part of the safety and environmental case. The number is a manufacturer claim to be validated with a trial, but the mechanism, faster mechanical clearing, is the case’s foundation.
How do you measure outcomes in your city?
The outcome measurement is the evidence the case needs:
- Track the clearing time per corridor before and after the kit;
- Record the pass counts and the chemical use per event;
- Monitor the service quality, because a faster pass that misses the standard is not a win;
- Collect the incident data where available, without claiming a causal link from a single season;
- Review the complaint and response records for the corridors.
The measurement should be per corridor and per event, and the comparison should use the same storms and the same service standards. The city’s own data, not the supplier’s brochure, is the safety evidence.
Prioritize the routes that matter
The safety case earns its budget by prioritizing: the corridors where the ice forms first, the traffic is highest, and the consequences are greatest get the fracture-capable edge first. The packed ice carbide kit page is the product reference, and the contact page is where the corridor data and the configuration conversation start.
Send the corridor list, the clearing-time data, and the incident history through the contact page and ask for the configuration and the trial terms. The safety case is built in minutes, and the minutes are measured on the city’s own corridors.
Expert view — SENTHAI engineering team: “Safety is measured in the minutes the corridor stays clear. The blade that breaks the ice first shortens the exposure.”
Frequently Asked Questions
How does clearing speed affect safety? Every minute of bonded ice is a minute of reduced traction, longer stopping distances, and slower emergency access. Faster clearing shortens the exposure.
Is the safety case only about crashes? No. It includes commute delays, transit reliability, access to services, economic activity, and public confidence.
How do I build the safety case? Identify the high-consequence corridors, document the current clearing time and passes, estimate the saving from a fracture-capable edge, and frame the investment per corridor.
How should I measure outcomes? Track clearing time, passes, chemical use, and service quality per corridor and event, and compare on the same storms and standards.
Can I claim a crash reduction from one season? No single-season comparison proves a causal link. Collect the incident data over time and present it as a trend, not a claim.
Does the kit reduce chemical use? SENTHAI states the kit can allow a significant reduction, often by up to 25–40%; the number is a claim to validate with the city’s own trial.
Which routes should get the kit first? The corridors where ice forms first, traffic is highest, and consequences are greatest. The prioritization is the safety case’s budget logic.
Sources
Related articles
Best Snow Plow Blade Family for Your Fleet: Top 5 ScenariosKnowledge Top 10 Snow Plow Blade Types for Winter Fleets (Ranked by Duty Fit)Knowledge
 Top 5 Best Carbide Blade Configurations for Highway PlowingKnowledge
 Best Snow Plow Blade Materials Ranked: Steel vs Carbide vs Cladding vs Rubber-CarbideKnowledge